Issues
Issues are relevant findings found by scanners.
The Issues section contains a table that provides a summary of the issues detected during the data source scans.
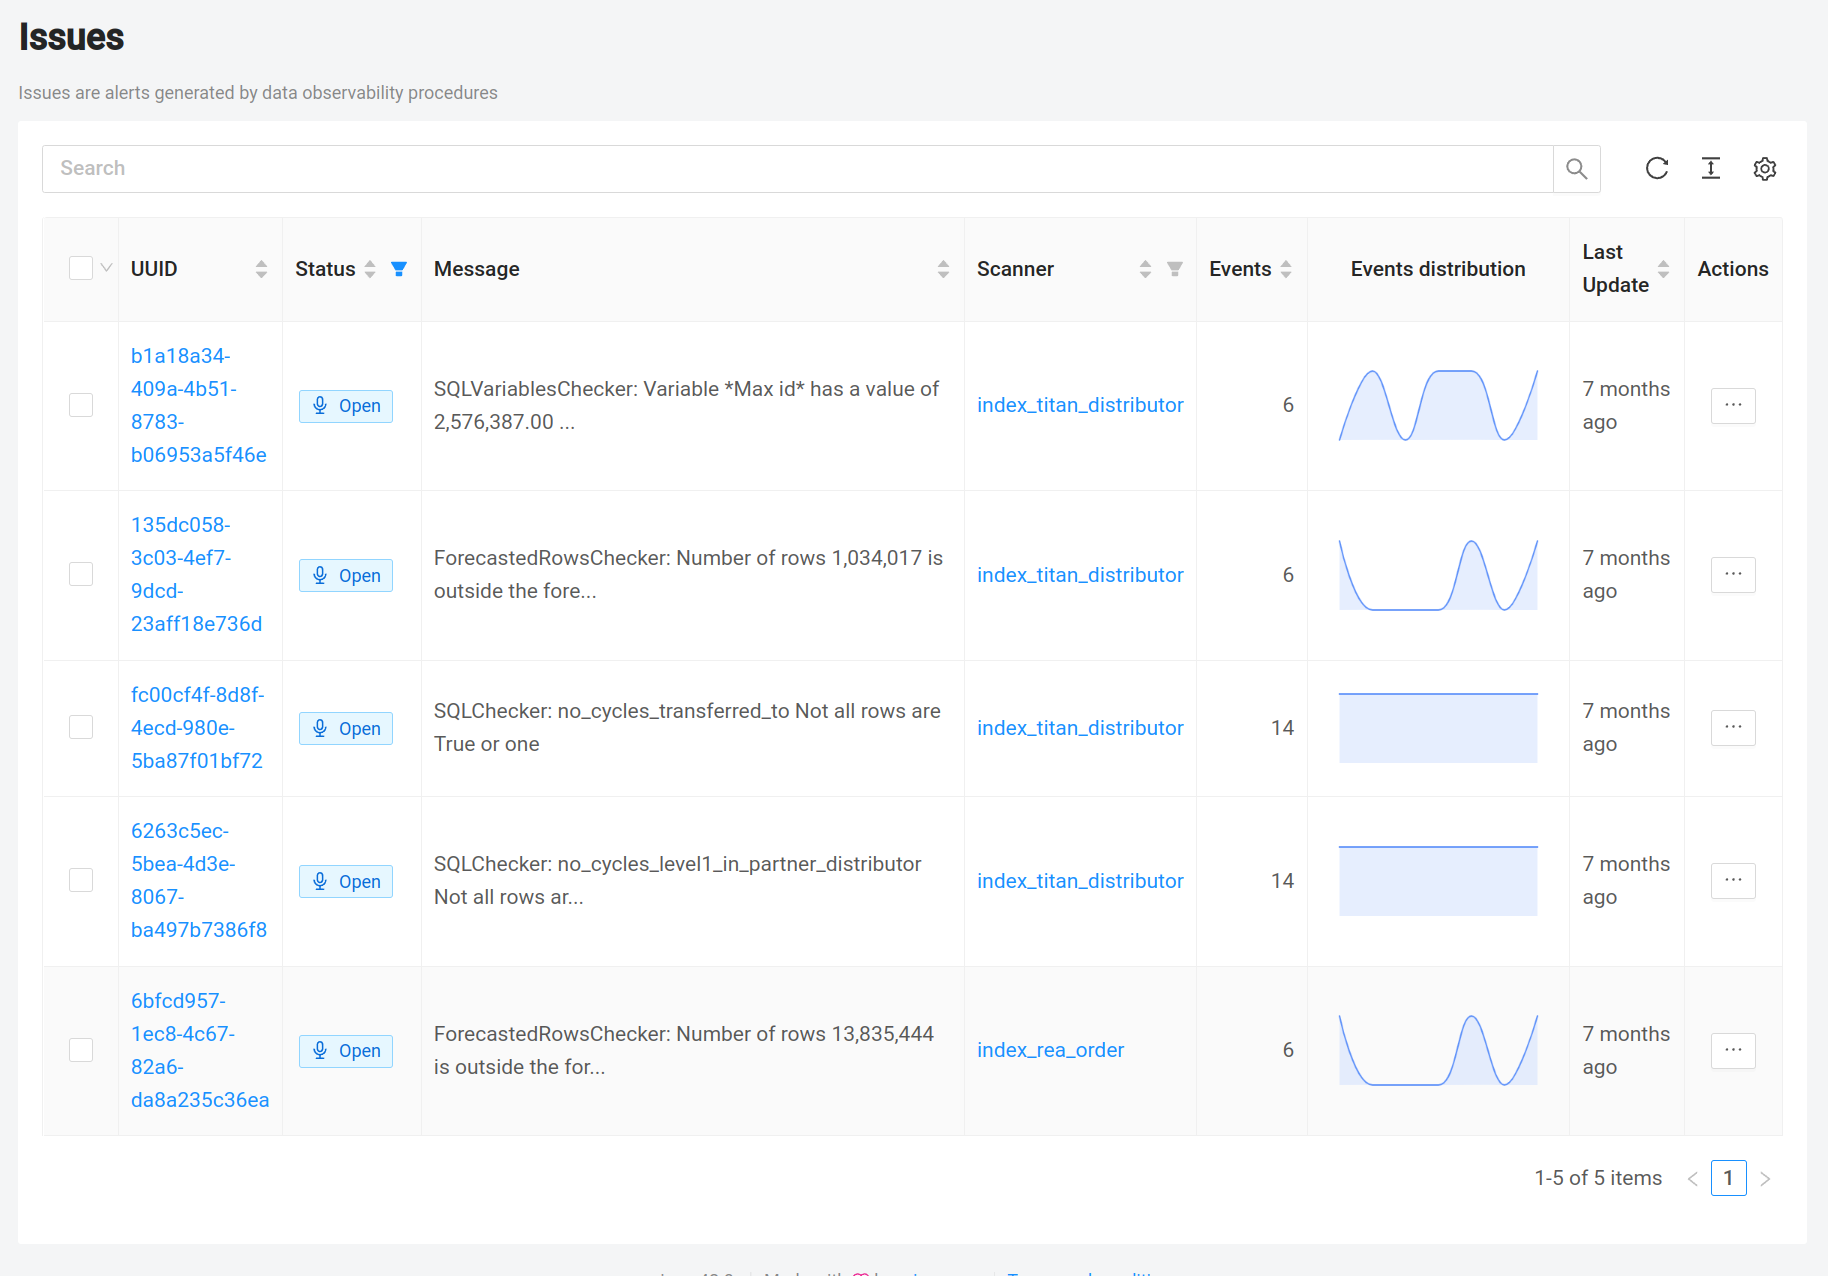
This table contains the following columns:
- UUID: A global unique identifier for each issue.
- Status: Indicates the current status of the issue, e.g. "Open", "Ignored", "Resolved".
- Message: A brief description of the issue, explaining what the problem is and what needs to be done to resolve it.
- Scanner: The name of the scanner that detected the problem.
- Number of Events: The number of times the problem was detected.
- Event Graph Distribution: A visual representation of the frequency of the issue over time.
- Last Update: The date and time the issue was last updated.
- Actions: The available actions that can be performed on the issue. The options include
- Edit: Allows the user to edit the issue details.
- Ignore for 1, 7, 30 days: Allows the user to temporarily ignore the issue for the specified number of days.
- Mark as resolved: Allows the user to mark the issue as resolved.
- Delete: Allows the user to delete the issue.
The Issues pane is an important data monitoring tool because it provides a centralized view of all detected issues and helps the user quickly identify and resolve any data anomalies.
Issue
The detailed view of an issue provides a comprehensive overview of a specific issue detected by a scanner. The view includes the current status of the issue so you can track its progress and resolution. You can also add comments to provide additional context or to coordinate with other stakeholders.
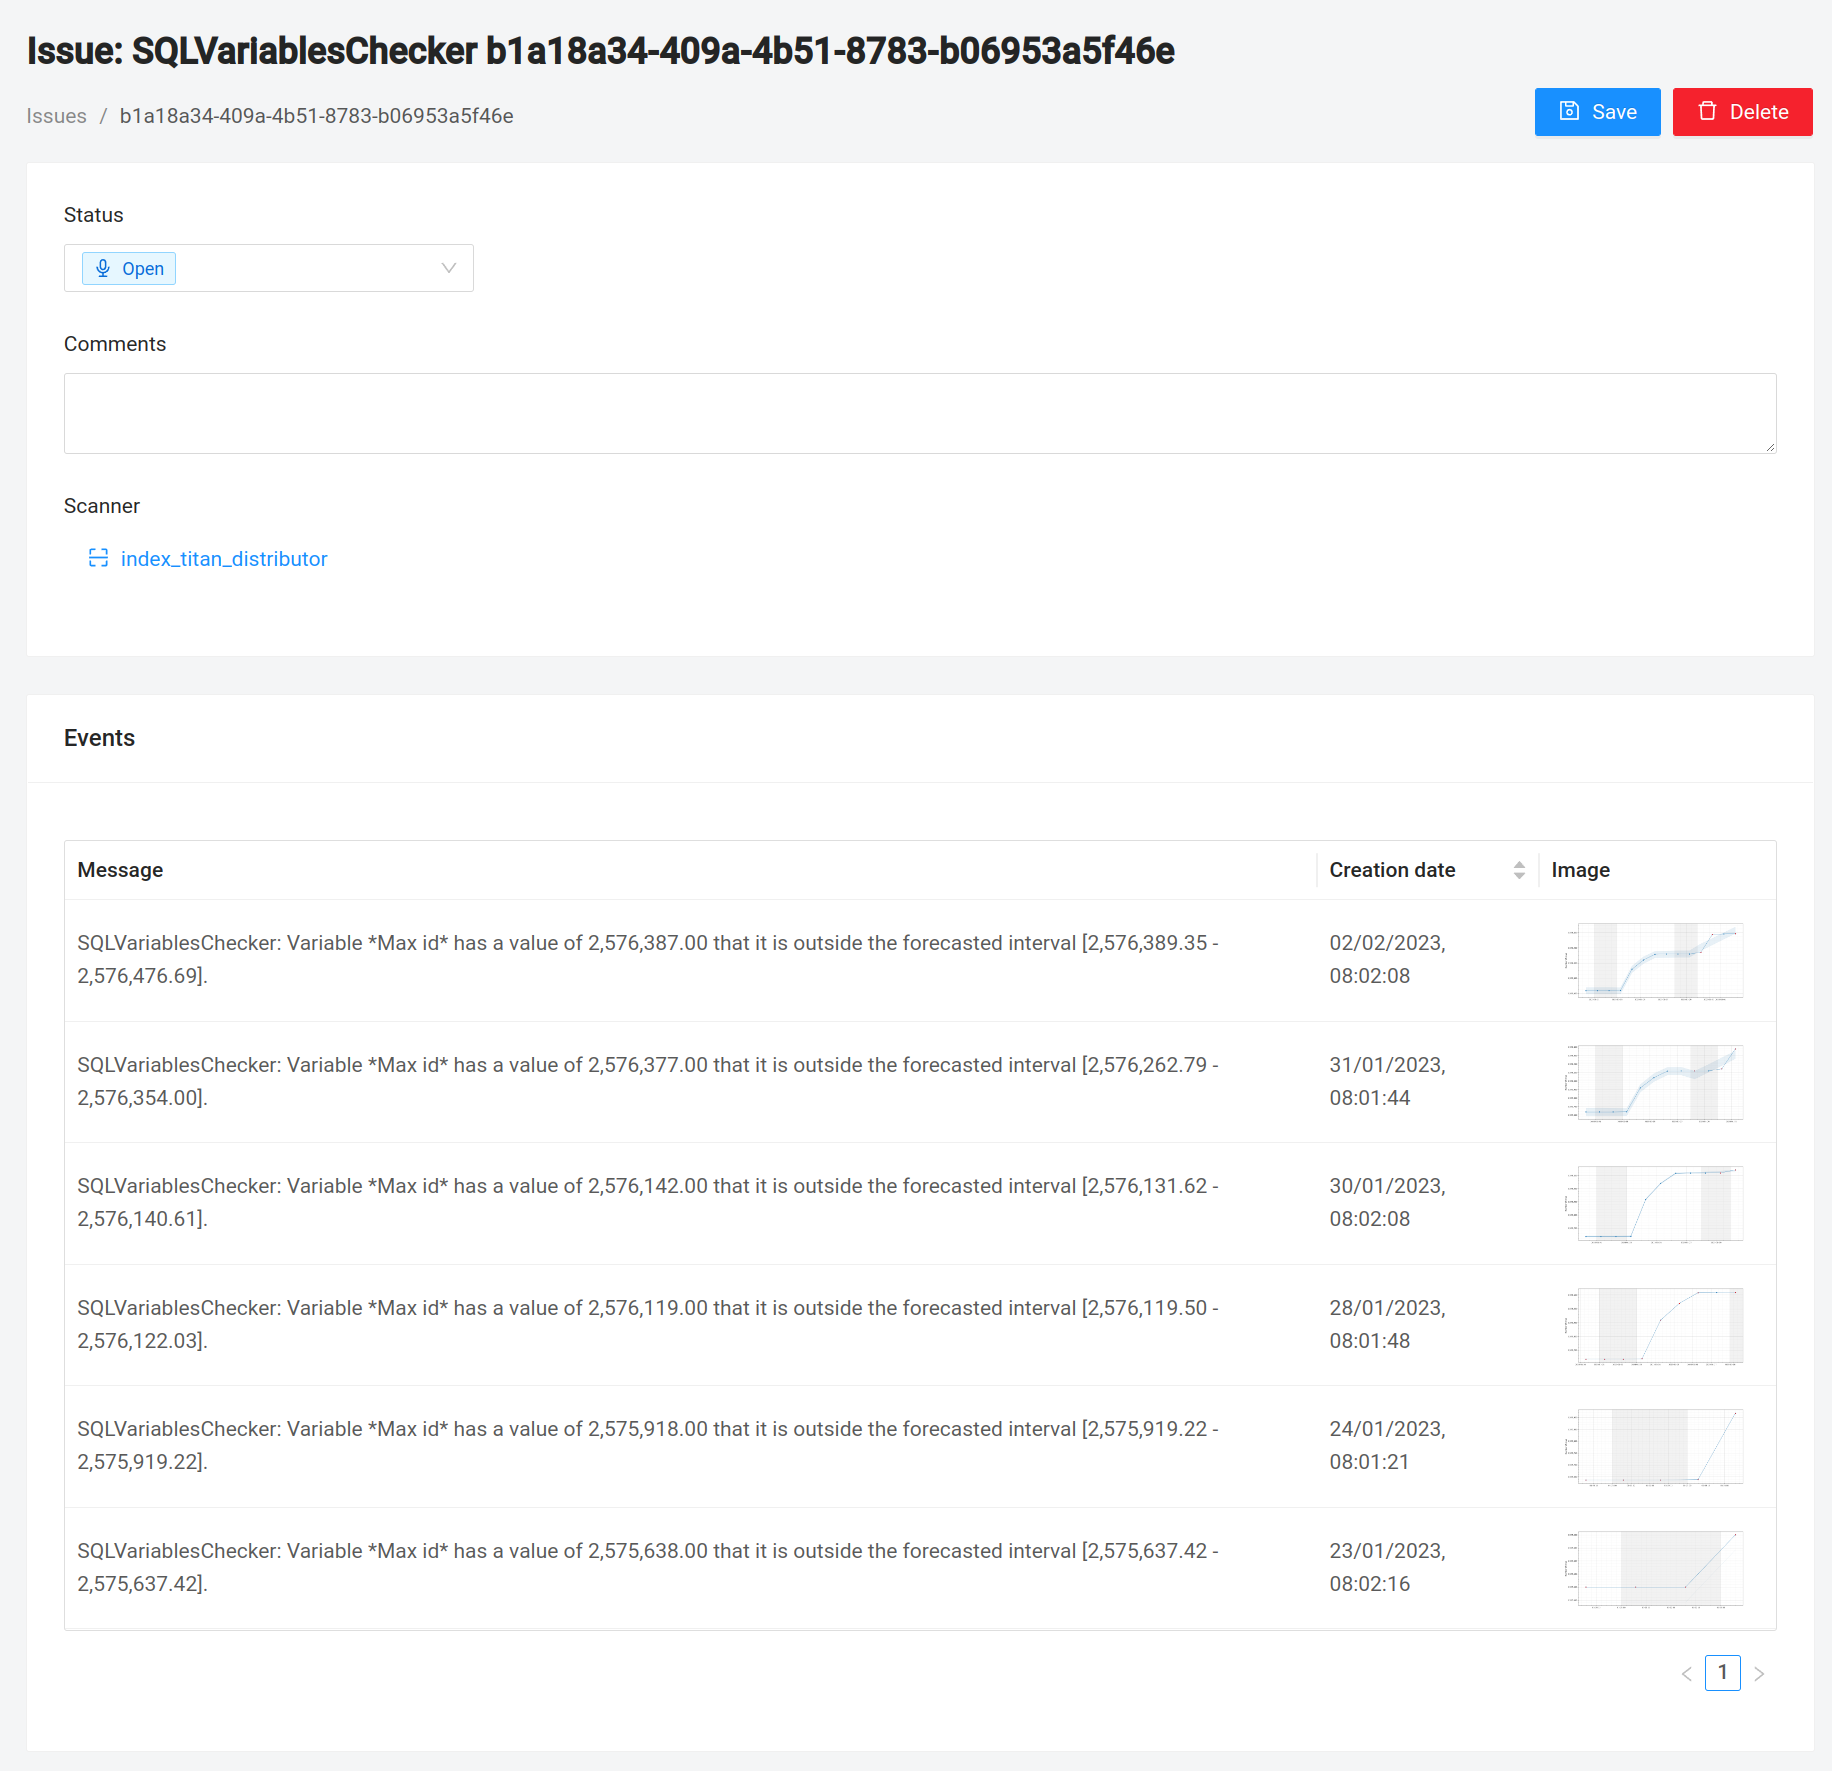
The view also includes a link to the scanner that created the issue, providing access to the original source of the problem. In addition, a table is displayed that lists all events associated with the issue, along with metadata about each event.
Events are the various recurrences of the issue over time
The metadata of the events includes information such as the date and time of the event, the number of rows affected, and other relevant details.
For example, if this issue is generated by a value from a forecast, the event will include a graph showing the predicted range of the forecast and its current value.
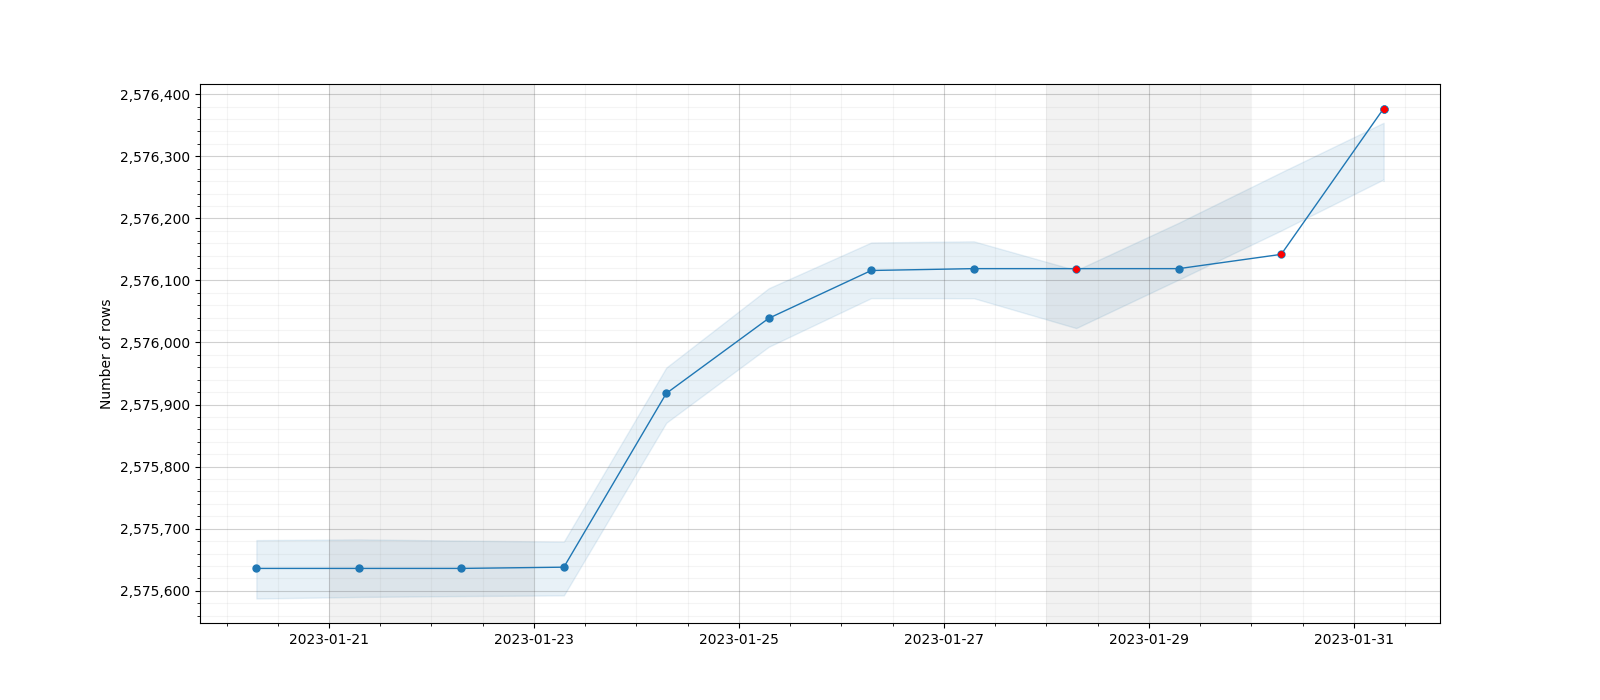
This detailed view allows you to better understand the problem, its history, and its potential impact on your data ecosystem. It also provides a central location to track and manage the issue, making it easier to resolve the problem and prevent future occurrences.